The most common mistake made by people who attempt to put together their first resume is that they put in too much information. They want to describe everything that they have ever done from the moment of conception to the present. The resume ends up being too long, and nobody will read it.

Thursday, April 12, 2012

Inside Bar Trading Strategy


Inside Bar Forex trading strategy — a popular system with a nice win/loss ratio but a rather rare occurrence of the proper entry conditions. It doesn't require any indicators and can be applied on the bare candlestick or bar chart.

Features

  • Entry conditions are clearly defined.
  • Very simple bare chart system.
  • High success rate.
  • Rare occurrence of the proper conditions.

How to Trade?

  1. An inside bar is a bar or a candlestick that completely fits into the first preceding bar (also called a "container" bar), including its High and Low values.
  2. If the current bar has an index of 0 and the previous bar has an index of 1 then the following conditions should be true for the current bar to count as an inside bar: High[0] < High[1] and Low[0] > Low[1]. Mind the strict "greater" and "less" operators.
  3. Bearish inside bar that follows a bullish "container" bar on the clearly visible uptrend signals a Short position.
  4. Bullish inside bar that follows a bearish "container" bar on the clearly visible downtrend signals a Long position.
  5. Stop-loss is set to the Low of the "container" bar for the Long positions and to the High of the "container" bar for the Short positions.
  6. Take-profit should be set to the nearest support/resistance level formed by the trend.
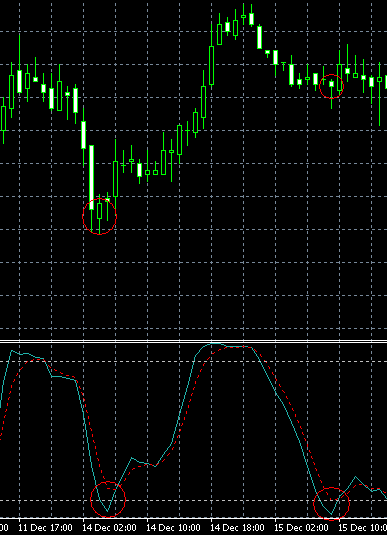
Example


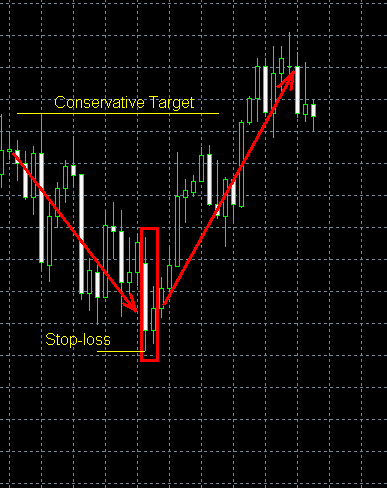
A bullish inside bar after a downtrend is shown on the example chart. The inside bar is easy to identify and the stop-loss level is rather conservative here. The target was set to the resistance level formed by the previous downtrend. As you can see, the currency pair rate reached the take-profit level without any problems.

Warning!

Use this strategy at your own risk. It's not recommended to use this strategy on the real account without testing it on demo first.

Combined Stochastic Oscillator/MA Trading Strategy


Combined Stochastic Oscillator/MA Forex trading strategy — is a relatively safe trading system that is based on the standard Stochastic Oscillator indicator in combination with the standard Exponential Moving Averages. You can use the moving averages as the general long-term trend indicator, while the stochastic will show you the short-term overbought/oversold states, where you can enter a successful pull-back trade.

Features

  • Rather reliable.
  • Trading with the trend.
  • Isn't very easy to follow.
  • No definite target/exit levels.

Strategy Set-Up

  1. Any currency pair should work. Use D1 timeframe for the long-term trend detection with the Exponential Moving Averages and H1 timeframe for the short-term signal receiving with the Stochastic Oscillator.
  2. Add 3 Exponential Moving Averages to the D1 chart, set periods to 50, 100 and 200.
  3. Add a Stochastic Oscillator indicator to the H1 chart, set its %K period to 14, %D period to 3 and slowing to 3, use Close/Close price field, set overbought level to 90% and oversold level to 10%.

Entry Conditions
Enter Long position when the long-term trend is bullish (the D1 chart shows price above EMA50, EMA50 above EMA100 and EMA100 above EMA200) and the stochastic crosses the oversold level from below on H1 chart.

Enter Short position when the short-term trend is bearish (the D1 chart shows price below EMA50, EMA50 below EMA100 and EMA100 below EMA200) and the stochastic crosses the overbought level from above on H1 chart.

Exit Conditions
There are no definite SL/TP levels, but the recommended risk/reward ratio is 1/2.

A rather tight trailing stop should be maintained.

Example
Bearish trend:


Bullish trend:


On the example charts you can see the December 14, 2009 signals generated both for the bearish EUR/AUD and for the bullish AUD/CHF charts. As you see, the signal line for stochastic oscillator is the actual stochastic, not its MA. The exponential moving averages should form an almost perfect trend for the more accurate signals. In the Short position example both positions would hit a rather optimistic take-profit. In the Long position example the second trade would end with almost no loss if a tight trailing stop was used.

Warning!

Use this strategy at your own risk. It's not recommended to use this strategy on the real account without testing it on demo first.

MACD Divergence Trading Strategy


MACD Divergence Forex trading strategy — is one of the quite reliable systems and is based on the standard MACD indicator. Actually, the divergence between MACD line and the currency pair rate is the basic signal in this strategy. This system has rather fuzzy entry and exit points, but it's easy to spot the signal and the trades can be rather profitable, as it helps to catch the pull-backs and the trend reversals.

Features

  • Easy to spot signals.
  • Only one standard indicator used.
  • Good profit potential on positions.
  • Take-profit and stop-loss levels are rather indefinite.
  • Rare occurrence on the long-term charts.

Strategy Set-Up

  1. Any currency pair and timeframe should work. But shorter timeframes are recommended, as they yield more opportunities.
  2. Add MACD (Moving Average Convergence/Divergence) indicator to the chart, set Fast EMA period to 12, Slow EMA period to 26 and MACD SMA to 9; apply to Close.

Entry Conditions
Enter Long position when the price shows a bearish trend and MACD indicator shows a bullish trend.

Enter Short position when the price shows a bullish trend and MACD indicator shows a bearish trend.

Exit Conditions
Set stop-loss to the nearby support level, when going Long, or to the nearby resistance level, when going Short.

Set take-profit to the next resistance level for Long positions, or to the next support level for Short positions.

If the system generates a reversal signal — close the previous position first.

Example


The example chart is EUR/USD currency pair at M15 timeframe. As seen on the chart, the price line was declining in a bearish trend, while the MACD indicator was rising in a bullish trend during rather long period. The entry point is marked at the level, where it's became clear that the downtrend is over on the currency pair chart. Stop-loss was set to the support level formed by the double-bottom chart pattern, while the take-profit level was set to the level of resistance formed by bearish trend's short-lived pull-backs. The TP/SL ratio is rather good here — about 1.5.

Warning!

Use this strategy at your own risk. It's not recommended to use this strategy on the real account without testing it on demo first.


Stochastic Oscillator Trading Strategy


Stochastic Oscillator Forex trading strategy — it's an interesting system with a rather low fail rate. It's based on a standard Stochastic Oscillator indicator, which signals a trend fatigue and change. That means that you will almost always enter on pull-backs, guaranteeing rather safe stop-loss levels.

Features

  • Simple to follow.
  • Only one standard indicator used.
  • Safe stop-loss levels.
  • Take-profit level isn't optimal.

Strategy Set-Up

  1. Any currency pair and timeframe should work. But longer timeframes are recommended.
  2. Add a Stochastic Oscillator indicator to the chart, set its %K period to 14, %D period to 7 and slowing to 7, use Simple MA method.

Entry Conditions
Enter Long position when the cyan line crosses the red one from below and both are located in the bottom half of the indicator's window.

Enter Short position when the cyan line crosses the red one from above and both are located in the upper half of the indicator's window.

Exit Conditions
Set stop-loss to the local maximum if going Long and to the local minimum if going Short.

The most comfortable level for take-profit is between 1 * SL and 1.5 * SL.

Close position immediately if another signal is generated.

Example


5 signals for this strategy can be seen on the example chart above. All stop-loss levels are marked with the yellow horizontal lines on the chart. The first signal is for Short position with a close stop-loss; take-profit is achievable here. The second one is a bullish signal, which turns out to be a wrong pull-back, but, fortunately enough, the stop-loss is quite tight here. The third signal is not a signal actually, because it's a bearish figure cross that appears in the bottom half of the window and thus is disregarded. Fourth signal is bullish with a stop-loss quite far away, but even the most aggressive take-profit level would work here. The final signal is for Short, with tight stop-loss and a lot of place for a rather profitable TP setting.

Ideally bullish and bearish signals should follow one after another but due to the occurrence of the false signals (bearish in the bottom half and bullish in the upper half of the window) it's not always so.

Warning!

Use this strategy at your own risk. It's not recommended to use this strategy on the real account without testing it on demo first.

Parabolic SAR Trading Strategy


Parabolic SAR Forex trading strategy — is a rather risky system that is based on direct signals of the Parabolic SAR indicator, which shows stop and reverse levels.

Features

  • Simple to follow.
  • Only one standard indicator used.
  • Entry and exit conditions are given directly by the indicator.
  • Indicator lag.
  • Very risky and not always effective.

Strategy Set-Up

  1. Any currency pair and timeframe should work.
  2. Add a Parabolic SAR indicator to the chart, set its step to 0.05 and maximum to 0.2.

Entry Conditions
Enter Long position when the current price touches the indicator from below and it changes its direction.

Enter Short position when the current price touches the indicator from above and it changes its direction.

Exit Conditions
Set stop-loss directly at the indicator level — above the price for Short positions and below the price for Long positions. Adjust stop-loss with each new bar.

Take-profit should be set to the same value as stop-loss but you shouldn't adjust it.

Example


As you can see on the example chart above, there are 6 entry points. The first one is bullish and leads to a profit. The second one is bearish and also reaches take-profit level. The third one is bullish and is a complete loss, as is the fourth one, which is, of course, bearish. The fifth one doesn't reach take-profit level but it closes with only a minor loss; it's bullish. The sixth one is a short position and has already reached its recommended take-profit.

Judging from above it's easy to conclude that short and long positions always follow one after another in this strategy and that it's not very reliable one.

Warning!

Use this strategy at your own risk. It's not recommended to use this strategy on the real account without testing it on demo first.

Get Paid To Promote, Get Paid To Popup, Get Paid Display Banner