
MACD Divergence Forex trading strategy — is one of the quite reliable systems and is based on the standard MACD indicator. Actually, the divergence between MACD line and the currency pair rate is the basic signal in this strategy. This system has rather fuzzy entry and exit points, but it's easy to spot the signal and the trades can be rather profitable, as it helps to catch the pull-backs and the trend reversals.
Features
- Easy to spot signals.
- Only one standard indicator used.
- Good profit potential on positions.
- Take-profit and stop-loss levels are rather indefinite.
- Rare occurrence on the long-term charts.
Strategy Set-Up
- Any currency pair and timeframe should work. But shorter timeframes are recommended, as they yield more opportunities.
- Add MACD (Moving Average Convergence/Divergence) indicator to the chart, set Fast EMA period to 12, Slow EMA period to 26 and MACD SMA to 9; apply to Close.
Entry Conditions
Enter Long position when the price shows a bearish trend and MACD indicator shows a bullish trend.
Enter Short position when the price shows a bullish trend and MACD indicator shows a bearish trend.
Exit Conditions
Set stop-loss to the nearby support level, when going Long, or to the nearby resistance level, when going Short.
Set take-profit to the next resistance level for Long positions, or to the next support level for Short positions.
If the system generates a reversal signal — close the previous position first.
Example
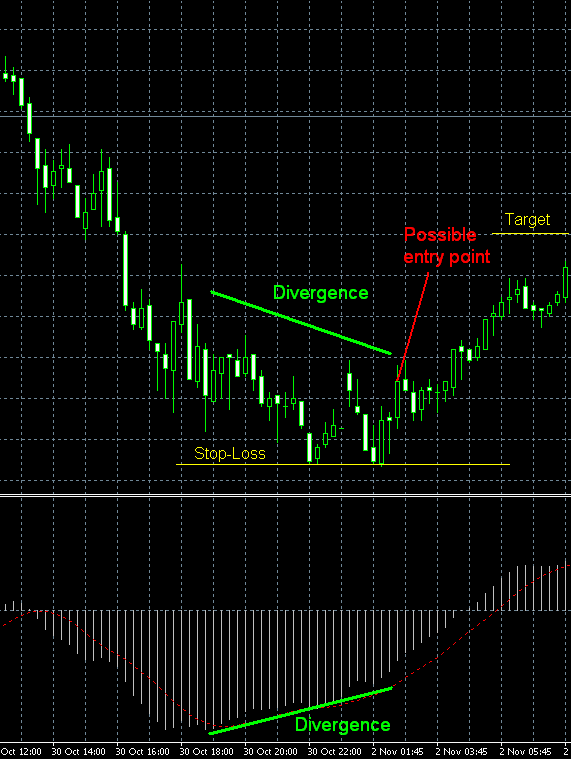
The example chart is EUR/USD currency pair at M15 timeframe. As seen on the chart, the price line was declining in a bearish trend, while the MACD indicator was rising in a bullish trend during rather long period. The entry point is marked at the level, where it's became clear that the downtrend is over on the currency pair chart. Stop-loss was set to the support level formed by the double-bottom chart pattern, while the take-profit level was set to the level of resistance formed by bearish trend's short-lived pull-backs. The TP/SL ratio is rather good here — about 1.5.
Warning!
Use this strategy at your own risk. It's not recommended to use this strategy on the real account without testing it on demo first.

No comments:
Post a Comment