The most common mistake made by people who attempt to put together their first resume is that they put in too much information. They want to describe everything that they have ever done from the moment of conception to the present. The resume ends up being too long, and nobody will read it.
Showing posts with label FOREX. Show all posts

Thursday, April 12, 2012

Forex Books for Beginners


Here you will find the Forex e-books that provide the basic information on Forex trading. You can learn basic concepts of the Forex market, the technical and fundamental analysis. While all these e-books are recommended for every new Forex trader, they won't be very useful to the very experienced traders.

Almost all Forex e-books are in .pdf format. You'll need Adobe Acrobat Reader to open these e-books. Some of the e-books (those that are in parts) are zipped.

If you are having problems downloading the books and you are using Google Chrome, try right-clicking a book download link and choose 'Save link as...'

If you are the copyright owner of any of these e-books and don't want me to share them, please, contact me and I will gladly remove them.

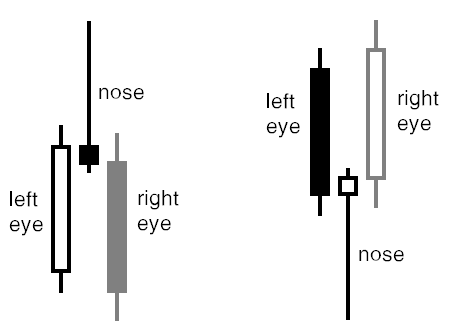
Candlesticks For Support And Resistance — The basics of trading with candlesticks charts by John H. Forman.

Online Trading Courses — Course #1 lesson #1 by Jake Bernstein.

Commodity Futures Trading for Beginners — by Bruce Babcock.

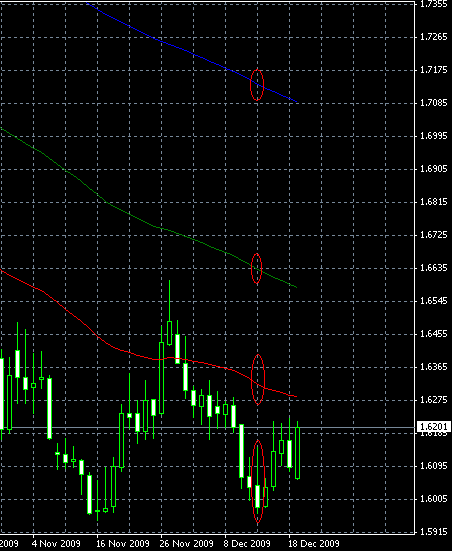
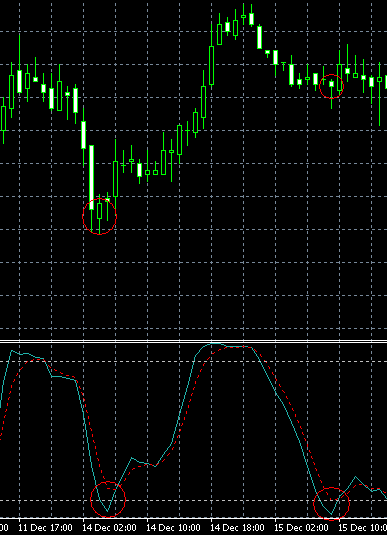
Hidden Divergence — by Barbara Star, Ph.D.

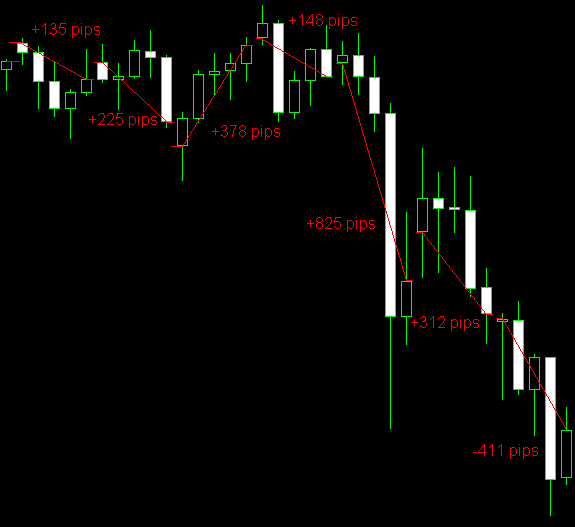
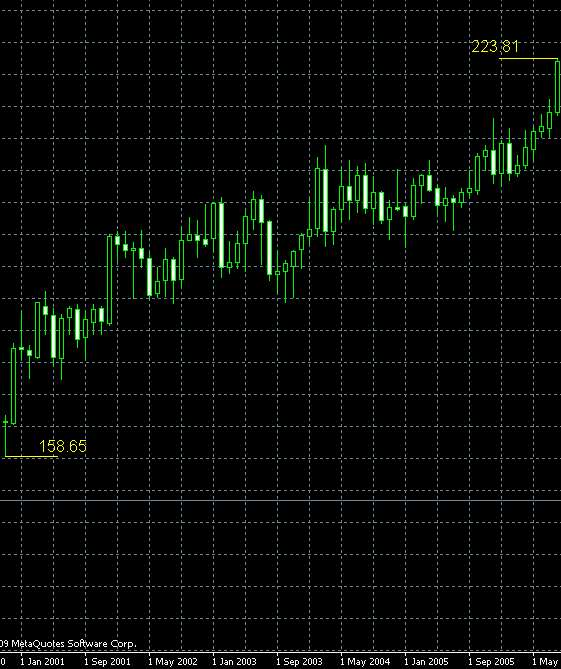
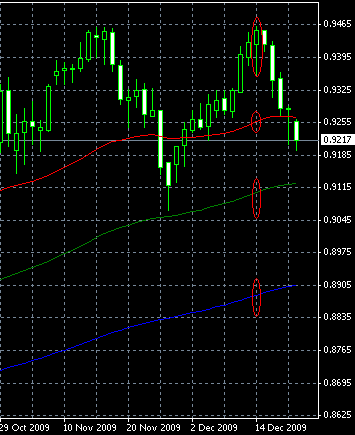
Peaks and Troughs — by Martin J. Pring.

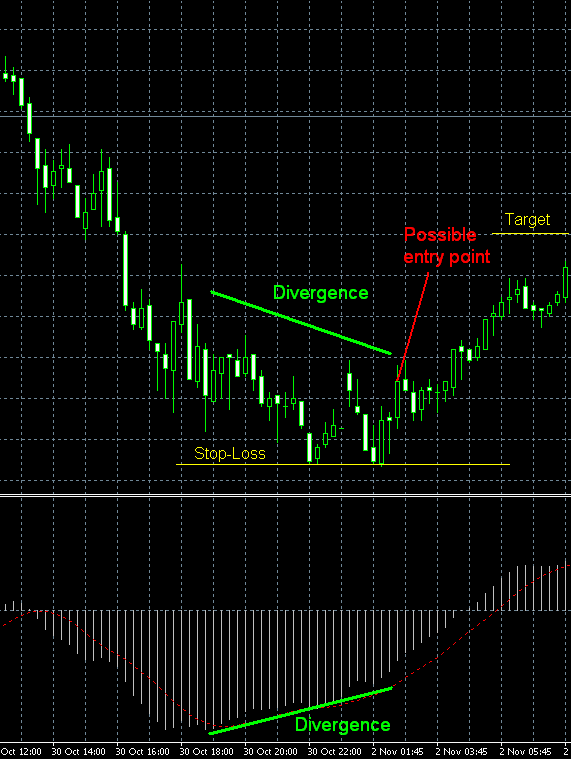
Reverse Divergences And Momentum — by Martin J. Pring.

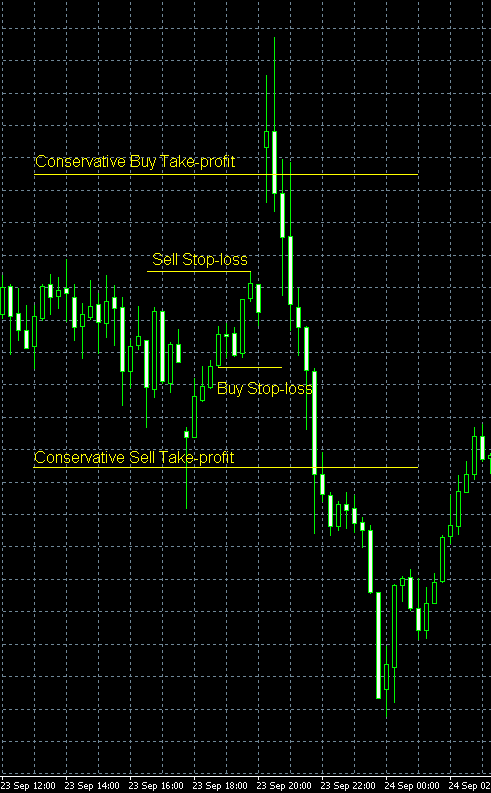
Strategy:10 — Low-risk, high-return Forex trading by W. R. Booker & Co.

The NYSE Tick Index And Candlesticks — by Tim Ord.

Trend Determination — A quick, accurate and effective methodology by John Hayden.

The Original Turtle Trading Rules — by OrignalTurtles.org.

Introduction to Forex — by 1st Forex Trading Academy. This trading course intends to provide to all of the students analytical tools on the trading system and methodologies. In this respect, the purpose of the course is to provide an overview of the many strategies that are being used in Forex market and to discuss the steps and tools that are needed in order to use these strategies successfully.

The Six Forces of Forex — by Scott Owens. A small e-book covering the basic and the main problems of Forex trading.

Study Book for Successful Foreign Exchange Dealing — by Royal Forex.

Forex. On-Line Manual for Successful Trading — an introduction into every aspect of the Forex trading including detailed descriptions of the technical and fundamental analysis techniques, by unknown author.

18 Trading Champions Share Their Keys to Top Trading Profits — as the name suggests, the book shares the secrets of the 18 prominent traders with the Forex beginners, by FWN.

The Way to Trade Forex — a 1st chapter of the book that will show you not only Forex basics but also some unusual techniques and strategies that can work for the newbie traders, by Jay Lakhani.

The Truth About Fibonacci Trading — the basic facts and information about Fibonacci levels and their application to the Forex trading, by Bill Poulos.

Quick Guide to Forex Trading — a 2008 edition of the Forex guide for the beginners and private traders issued by Easy-Forex.

Chart Patterns and Technical Indicators — an explanation of the most popular chart patterns and some technical indicators, by unknown author.

Forex Trading — a rather generic all-topic guide for beginners in Forex trading, by Richard Taylor.

Trading Forex: What Investors Need to Know — by NFA. National Futures Association gives introduction to the online retail Forex trading and warns about the potential dangers of such activity.*

My Dog Ate My Forex — by Doug Breiten. A rather generic Forex e-book that, nevertheless, shares some useful insights with the Forex traders on their road to success.

Books on Trading Strategies

Forex strategy e-books that are listed here provide information on the specific trading strategies as well as the use of particular Forex trading instruments. Basic knowledge of Forex trading is required to correctly understand and use these strategies.

Almost all Forex e-books are in .pdf format. You'll need Adobe Acrobat Reader to open these e-books. Some of the e-books (those that are in parts) are zipped.

If you are having problems downloading the books and you are using Google Chrome, try right-clicking a book download link and choose 'Save link as...'

If you are the copyright owner of any of these e-books and don't want me to share them, please, contact me and I will gladly remove them.

1-2-3 System - a simple pattern trading system by Mark Crisp.

Bollinger Bandit Trading Strategy - a trading system based on Bollinger bands indicator by unknown author.

Value Area - from The Likos Letter.

The Dynamic Breakout II Strategy - by unknown author.

Ghost Trader Trading Strategy - by unknown author.

King Keltner Trading Strategy - by unknown author.

Scalp Trading Methods - by Kevin Ho.

LSS - An Introduction to the 3-Day Cycle Method - by George Angell.

Market Turns And Continuation Moves With The Tick Index - by Tim Ord.

The Money Manager Trading Strategy - by unknown author.

Picking Tops And Bottoms With The Tick Index - by Tim Ord.

The Super Combo Day Trading Strategy - by unknown author.

The Eleven Elliott Wave Patterns - by unknown author.

The Thermostat Trading Strategy - by unknown author.

Intraday trading with the TICK - by Christopher Terry.

Traders Trick Entry - by Traders Educators of Traders University.

Fibonacci Trader Journal - a journal covering different trading techniques based on Fibonacci indicators, by Robert Krausz. 12 issues.

Rapid Forex - a set of aggressive Forex trading strategies (Rapid Forex) by Robert Borowski and Stephen A. Pierce.

Microtrading the 1 Minute Chart - a small e-book aimed on Forex newbies to teach them the basics of M1 scalping.

BunnyGirl Forex Trading Strategy Rules and FAQ - set of rules for a BunnyGirl trading strategy based on WMA crossing.

The Daily Fozzy Method - by Michael Dunbar.

Forex Trader's Cheat Sheet - real Forex cheat sheet for position entry times/conditions by Quantum Research Management Group.

Offset Trading - a basic Forex news trading range breakout system by Dana Martin.

How to Trade Both Trend and Range Markets by Single Strategy? - by S.A. Ghafari.

A Practical Guide to Technical Indicators; Moving Averages - by S.A. Ghafari.

FX Wizard - essential Forex trading rules by Rob Walton.

FX Destroyer - a description of a rather simple Forex trading strategy, involving moving averages, parabolic SAR and ADX indicators, by Izu Franks.

A Practical Guide to Swing Trading - a simple and practical guide to the swing trading strategy, by Larry Swing.

Practical Fibonacci Methods for Forex Trading - practical guide to Fibonacci levels with the real trade examples of the Forex strategy based on these levels, by Ken Marshall and Rob Moubray.

Using The Heikin-Ashi Technique - a short but detailed guide to trading using Heikin-Ashi charting technique, by Dan Valcu.

The Day Trade Forex System - an indicator-based strategy with detailed description, chart examples and minor advertising, by Erol Bortucene and Cynthia Macy.

5/13/62 - a revised and updated EMA-based Forex trading strategy explained in the 3-grade language, by Rob Booker.

Not So Squeezy Trading Manual - a description for the rather interesting trading strategy that utilizes indicators package under the same name, by Akuma99.

KobasFX Strategy - a simple MA+MACD Forex trading strategy by Obaseki O. A.

Killer Patterns - a simple trading strategy based on MACD and trend lines by Philip Birchley.

3D Trading - a detailed description of a trading strategy that employs Elliott Waves, price & time patters, Gann rules, Williams' Percentage Range and MACD indicators; by Ruben Topaz.


Forex Gap Strategy


Forex Gap Strategy — is an interesting trading system that utilizes one of the most disturbing phenomena of the Forex market — a weekly gap between the last Friday's close price and the current Monday's open price. The gap itself takes its origin in the fact that the interbank currency market continues to react on the fundamental news during the weekend, opening on Monday at the level with the most liquidity. The offered strategy is based on the assumption that the gap is a result of speculations and the excess volatility, thus a position in the opposite direction should probably become profitable after a few days.

Features

  • Regular trading with clear rules.
  • No stop-loss hunting or premature hits.
  • Statistically proven profit.
  • You have to open position at the week's beginning and close it right before the end.

How to Trade?

  1. Select a currency pair with a relatively high level of volatility. I recommend GBP/JPY as it showed the best results during my tests. But other JPY-based pairs should work too. By the way, it's a good strategy to use on all major currency pairs at the same time.
  2. When a new week starts look if there is a gap. A gap should be at least 5 times the average spread for the pair. Otherwise it can't be considered a real signal.
  3. If Monday's (or late Sunday's if you trade from North or South America) open is below the Friday's (or early Saturday if you trade from Oceania or Eastern Asia) close the gap is negative and you should open a Long position.
  4. If Monday's open is above the Friday's close the gap is positive and you should open a Short position.
  5. Don't set a stop-loss or a take-profit level (it's a rare occasion but stop-loss isn't recommended in this strategy).
  6. Right before the end of the weekly trading session (e.g., 5 minutes before the end) you need to close the position.

Example


You can see GBP/JPY pair's last 7 weeks (as of May 24, 2010) and all of them have gaps. 6 out of 7 gaps give correct signals that result in a lot of profit. The last gap gives a wrong signal and yields a medium loss. The average spread for GBP/JPY was 3 pips during the example period and all gaps were much wider than 15 pips, making them all qualifying signals. The net total profit was 1,612 pips in 7 weeks — not that bad.

Warning!

Use this strategy at your own risk It's not recommended to use this strategy on the real account without testing it on demo first.

Carry Trade Strategy


Carry Trade strategy — it's one of the most popular fundamental Forex trading strategies. It's used not only by the common retail traders but also by the big hedge funds. The main principle of the carry trade strategies is to buy currency with a high interest rate and sell one with a low interest rate. Such setup offers profit not only from the currency pair's fluctuations but also from the interest rate difference (overnight interest rate). This strategy should only be applied under the normal global economic conditions. You should never use it during the crisis. Remember that your Forex broker should be one of those that actually pay overnight interest rate difference if you want to earn from it. You won't be able to earn from it if your broker is "swap-free".

Features

  • Long-term profit potential.
  • Two sources of profit.
  • Works only with the growing global economy.

How to Trade?

  1. Choose a currency pair with a rather high positive interest rate difference (AUD/JPY, NZD/JPY and GBP/JPY are good historical examples of such pairs).
  2. Go Long or Short on the chosen pair, depending on the direction with the positive overnight interest rate for this pair.
  3. Choose moderate position size, so that it would be able to hold a significant paper loss.
  4. Don't set a stop-loss (one of the few Forex trading strategies, where stop-loss isn't recommended).
  5. Wait.
  6. When you feel that you earned enough or you expect some global financial turmoil, close the position.

Example
The example chart depicts a long-term "carry trade" growth of GBP/JPY from late 2000 till mid 2006. The pound had an interest rate of about 5% during the period, while the yen had its rate near zero, resulting in an overnight rate of about 5%, which is then multiplied by your leverage. With 1:100 leverage it's approximately 2,500% over the whole period. During the period GBP/JPY also rose by more than 6500 pips. As you see, the profit potential is simply outstanding.

The problem is that the uptrend ended very fast in 2007 and traders had little time to react and close the positions. The carry trade is quite risky and you should be very careful when deciding to use it.

Warning!
Use this strategy at your own risk.It's not recommended to use this strategy on the real account without testing it on demo first.

Forex Strategies


Forex trading can't be consistently profitable without adhering to some Forex strategy. It takes time and effort to build your own Forex trading strategy or to adapt an existing one to your trading needs and style. It's important to choose a strategy or system that is easy to follow with your daily trading schedule and that can be applied successfully with your account balance size. In this Forex strategy repository you'll find various strategies that are divided into three major categories:

  • Indicator Forex Strategies
  • Price Action Forex Strategies
  • Fundamental Forex Strategies

Indicator Forex Strategies are such trading strategies that are based on the standard Forex chart indicators and can be used by anyone who has an access to some charting software (e.g. MetaTrader platform). These Forex strategies are recommended to traders that prefer technical analysis indicators over everything else:


Price Action Forex Strategies are the currency trading strategies that don't use any chart or fundamental indicators but instead are based purely on the price action. These strategies will fit both short-term and long-term traders that don't like the delay of the standard indicators and prefer to listen as the market is speaking. Various candlestick patterns, waves, tick-based strategies, grid and pending position systems — they all fall into this category:


Fundamental Forex Strategies are the based on purely fundamental factors that stand behind the bought and sold currencies. Various fundamental indicators, such as interest rates and macroeconomic statistics, affect the behavior of the Forex market. These strategies are quite popular and will benefit long-term traders that prefer fundamental data analysis over technical factors:


If you want to share your Forex trading strategy with other traders, or want to ask some questions regarding the strategies presented here, please, join a discussion of the Forex strategies at the forum.


Important News Trading Strategy


Important Forex News trading strategy — developed specifically to trade Forex news with as little risk as possible. It can be used only for important Forex news releases such as U.S. GDP, non-farm payrolls and interest rate decisions. Although all currency pairs react on such news, the USD-based currency pairs show the best result.

Features

  • Trades will have fundamental background.
  • Not very hard to set up.
  • High success rate.
  • Important news events are quite rare.
  • High volatility and spread widening during important news releases.

How to Trade?

  1. Choose an important news release that has an effect on the Forex pairs.
  2. For EUR/USD I recommend: U.S. GDP, U.S. nonfarm payrolls, U.S. interest rate decisions, Eurozone interest rate decisions and U.S. budget deficit reports.
  3. Enter both Long and Short positions approximately 30 minutes before the releases (to protect yourself from slippage and ungodly spreads).
  4. Stop-loss for the Long position should be set around the 1-2 hour local minimum.
  5. Stop-loss for the Song position should be set around the 1-2 hour local maximum.
  6. Take-profit for both positions should be set at least to twice the level of stop-loss. I'd recommend even setting it to 3 * SL.
  7. Don't forget to cancel the untriggered orders after the news went out.

Example


The example chart depicts EUR/USD M15 behavior during the interest rate decision announcement by the FOMC on September 23rd, 2009. Both stop-loss levels are clearly visible in this situation. The conservative take-profit levels are easily hit. Only Long position triggers a TP, while the Short one is closed by SL.

It's possible to trade such news with the pending orders for more potential profit (setting entry points at the same levels as the stop-loss levels are set for the opposite position). But it's more risky.

Warning!

Use this strategy at your own risk. It's not recommended to use this strategy on the real account without testing it on demo first.

Pinbar Trading System


Pinbar Forex Trading System — a popular strategy for entering and exiting positions that is based on the particular candlestick pattern and the following price action. The Pinbar (also known as "Pin-bar" or "Pin bar") pattern was first introduced by Martin Pring in his Pring on Price Patterns.

Features

  • Conservative strategy offers low-risk high-yield opportunities.
  • No-loss rate is pretty high if break-even is applied.
  • Rare occurrence.
  • Timing is critical.
  • Support/resistance is difficult to formalize.

Strategy Set-Up
Any currency pair and timeframe should work, but longer-term timeframes (such as H4, D1 and W1) should work better.

Pinbar Set-Ups:


The pattern consists of three bars: the left eye, the nose and the right eye. The left eye should be a bar up for the bearish Pinbar pattern or a bar down for the bullish pattern. The nose bar should open and close inside the left eye, but its high (or low, for the bullish set-up) should protrude much farther than the left eye's high (or low). Both the nose bar's open and close should be located in the bottom (top, for the bullish set-up) 1/4 of the bar. The right eye is where the trading happens.

An additional condition for the good pattern set-up is the strong support/resistance level formed either behind the eyes or near the point of the nose. The stronger are the support/resistance levels you incorporate into this pattern, the more accurate it will be.

You can use the MetaTrader Pinbar Detector indicator to automate the Pinbar pattern detection.

Entry Conditions
Aggressive entry option is to enter a position when in the right eye price retreats behind the left eye's close level.

Conservative entry point is below (above for bullish set-up) the nose bar.

Exit Conditions
Conservative stop-loss can be set behind the nearest support/resistance level behind the eyes. A less conservative approach would be to set stop-loss to immediately behind the nose bar point (in this case, your reward/risk ratio may suffer).

Conservative take-profit can be set immediately after the left eye low (high for the bullish set-up). Aggressive take-profit level may be placed farther — to the next strong support (resistance for bullish positions) level.

Examples
Bearish Pinbar Set-Up:

This is an example of the aggressive set-up. The entry point (blue line) is positioned at the left eye close (price retreated for that entry). Stop-loss (red line) is placed at behind the point of the nose bar (in this situation, even conservative stop-loss wouldn't be hit, as the price pull-back during the right eye happened before the entry). Take-profit (green line) is set at the nearby support level and is easily filled.


Bullish Pinbar Set-Up:

This is an example of the conservative set-up. The entry point (blue line) is placed just behind the nose bar. Stop-loss (red line) is below the left eye. Take-profit (green line) is just above the left eye.

Warning!

Use this strategy at your own risk. It's not recommended to use this strategy on the real account without testing it on demo first.


Pinbar Detector


Pinbar Detector (MetaTrader indicator) — tries to detect Pinbars (or "Pin-bar", or "Pin bar") and marks them by placing "smiling face" symbols below the bullish Pinbars and above the bearish Pinbars. It's a pure price action indicator, which isn't using any standard technical indicators in its code. The configuration of Pinbar detection can be modified via the input parameters. Pinbar Detector can issue platform alerts and email alerts on detection. The indicator is available both for MT4 and MT5 versions of the trading platform.

Input parameters:

  • UseAlerts (default = true) — tells the indicator to issue platform alert with sound on Pinbar detection.
  • UseEmailAlerts (default = false) — tells the indicator to issue an email alert on Pinbar detection. Email should be properly configured in MetaTrader via Tools->Options->Email.
  • UseCustomSettings (default = false) — tells the indicator to use custom Pinbar detections parameters described below.
  • CustomMaxNoseBodySize (default = 0.33) — maximum allowed body/length ratio for the Nose bar.
  • CustomNoseBodyPosition (default = 0.4) — Nose body should be position in top (bottom for bearish pattern) part of the Nose bar.
  • CustomLeftEyeOppositeDirection (default = true) — tells the indicator that the Left Eye bar should be bearish for bullish Pinbar, and bullish for bearish Pinbar.
  • CustomNoseSameDirection (default = true) — tells the indicator that the Nose bar should be of the same direction as the pattern itself.
  • CustomNoseBodyInsideLeftEyeBody (default = false) — tells the indicator that the Nose body should be inside the Left Eye body.
  • CustomLeftEyeMinBodySize (default = 0.1) — minimum size of the Left Eye body relative to the bar length.
  • CustomNoseProtruding (default = 0.5) — minimum protrusion of the Nose bar relative to the bar length.
  • CustomNoseBodyToLeftEyeBody (default = 1) — maximum size of the Nose body relative to the Left eye body.
  • CustomNoseLengthToLeftEyeLength (default = 0) — minimum Nose length relative to the Left Eye length.
  • CustomLeftEyeDepth (default = 0.2) — minimum depth of the Left Eye relative to its length. Depth is length of the part of the bar behind the Nose.

As you can see on the chart above, the indicator isn't perfect as are the Pinbar pattern itself. It's recommended to try different detection settings to filter patterns according to your own image of the perfect Pinbar. A good idea would be to attach this indicator to long-term timeframes (H1 to W1) on all currency pairs you are comfortable trading in. Then, alerts would let you know once the trading opportunity arises.

Support and Resistance Trading Strategy


Support and Resistance Forex trading strategy — is a widely used trading system based on the horizontal levels of support and resistance. These levels are formed by the candlesticks' highs and lows. A break-through of these levels after a period of consolidation gives a signal for a trend. This strategy doesn't require any chart indicators except for the ability to draw lines (at least imaginary).

Features

  • Well-defined low stop-loss.
  • Relatively high success rate.
  • Unclear target levels.

How to Trade?

  1. Support level is formed by the lows of two or more candlestick bars that form a rather straight horizontal line with no lower lows between them.
  2. Resistance level is formed by the highs of two or more candlestick bars that form a rather straight horizontal line with no higher highs between them.
  3. Consolidation is a period without any trend, forming near support or resistance level, with the relatively small candlestick bodies.
  4. A close below the support level signals a short position.
  5. A close above the resistance level signals a long position.
  6. Stop-loss is set to the low of the previous candlestick (for the long positions) or to the high of the previous candlestick (for the short positions).
  7. Take-profit can be set relatively to the stop-loss or as a trailing stop of some sort.

Example
Support set-up:


Resistance set-up:


A period of consolidation is clearly seen on both example charts. In both cases the support/resistance level is formed by two candles on a rather short period. Stop-loss is placed close to the entry level. Take-profit couldn't be clearly set at the position entry moment, but a risk/reward ratio of not less than 1:2 could be used easily.

Warning!

Use this strategy at your own risk. It's not recommended to use this strategy on the real account without testing it on demo first.

Scalping Forex Strategy


Scalping Forex strategy — is a simple trading system that relies on very close targets, extremely low stop-loss and a lot of positions opened and closed during a short period of time. Not all Forex brokers allow scalping and not all that allow are good to scalp with. Scalping may not be suitable for all traders and, personally, I don't recommend scalping to anyone. The most simple scalping Forex trading system is presented here.

Features

  • Nice profits for lucky (intuitive) traders.
  • No need to pay attention to technical, fundamental or any other analysis.
  • Spreads eat a big part of profit.
  • Reward/risk ratio is usually too low.
  • Not all Forex brokers allow scalping.
  • Requires a lot of time for trading and monitoring.

How to Trade?

  1. Currency pairs with a lot of intraday volatility but low spreads are recommended (EUR/JPY, GBP/USD, EUR/USD and USD/JPY are good examples).
  2. M1 timeframe or lower is optimal.
  3. Optimal trading time is during the European/U.S. and U.S./Asian trading sessions' intersection.
  4. Prepare to enter the positions by closely monitoring the market activity for 5–15 minutes.
  5. When you think that you "caught" the current short-term trend, enter a position.
  6. Set stop-loss to about 10 pips.
  7. The general rule for target profit is one or one-and-a-half spreads. Setting take-profit to such low levels (2–5 pips) is almost impossible, so you'll need to monitor the position to see the target profit and close it manually.

Example
No example chart is present for this trading system as there is nothing important to be shown on the chart. Let's view the following examples.


  1. You open Long position on EUR/USD with 10 pips stop-loss and target for 4 pips of profit. After 20 second the position reaches 4 pips of profit and you close it.
  2. You open Short position on GBP/USD with 10 pips stop-loss and target for 4 pips of profit. After 3–4 minutes the trend unexpectedly reverses and the position is closed by stop-loss.
  3. You open Short position on USD/JPY with 10 pips stop-loss and target for 3 pips of profit. After about 1 minute the position reaches 4 pips of profit and you close it.
  4. You open Long position on EUR/JPY with 10 pips stop-loss and target for 5 pips of profit. After 5 seconds the price spikes and the position reaches 12 pips of profit and you close it.
  5. That's 10 pips of profit in less than 6 minutes. Of course, it's purely hypothetical.

Warning!

Use this strategy at your own risk. It's not recommended to use this strategy on the real account without testing it on demo first.

Martingale Trading System


Martingale trading system — is based on the popular betting (gambling) system of the 18th century France. The main principle of this system is to double the bet each time you lose so that if you win (considering a 100% bet win/loss each time) you recover a previous loss and will also gain the first bet amount. If one had an infinite amount of money, this strategy would be a sure-fire thing as with the infinite amount of bets the necessary result will with probability 1 eventually come. The problem is that no trader possesses an infinite wealth and thus utilizing this strategy eventually leads to a wiped account. Although it's a very popular Forex trading system and is used in many paid Forex expert advisors, I strongly don't recommend trading with it.

Features

  • Theoretically bullet-proof system.
  • Practically unsound.
  • Reward/risk ratio can reach extremely low values.

How to Trade?

  1. Any currency pair and timeframe will work.
  2. Determine your basic position size.
  3. Place an order in a random direction (Buy or Sell) with some fixed stop-loss and the same take-profit.
  4. After the SL or TP is triggered you either win or lose.
  5. If you win, set the position size to the initial and go the step 3.
  6. If you lose, double the position size and go to step 3.
  7. If you have infinite trading account balance, eventually you'll win a lot. If your account balance is limited you'll lose it eventually.

Example
No example chart is present for this trading system as there is nothing important to be shown on the chart. Let's view the following example.


  1. You start with $10,000 account and can trade with mini Forex lots (0.1 of the standard lot) and decide to trade on EUR/USD.
  2. You define your basic position size as 0.1 lots.
  3. You decide to go Long setting stop-loss at 40 pips (or $4). The take-profit is set to the same value.
  4. You lose the position. Now your account balance is $9,996.
  5. You double your next position size to 0.2 lots, so that using the same stop-loss and take-profit levels you risk $8 and also have a chance to win $8. You decide to change the position's direction and go Short.
  6. You win and now you've recovered lost $4 and also won $4. Your account balance is $10,004.
  7. You return your position to initial 0.1 lots and start over.
  8. With $10,000 account balance and $4 basic risk value you'll have to lose 11 positions in a row to wipe your account. You'll have to win 250 positions to double your balance.

Warning!

Use this strategy at your own risk. It's not recommended to use this strategy on the real account without testing it on demo first.

Simple Price Based Trading System


Simple Price Based Forex trading system — an interesting system that was developed by one of the Forex traders recently. It works for any pair (though, EUR/USD is recommended) and in all market conditions. No indicators are required to trade using this system. All you need is the ability to set up the pending orders.

Features

  • Position-based trading for any state of the market.
  • Trailing stop protects profit.
  • Lack of statistical proof.

How to Trade?

  1. Higher timeframe chart is recommended as each trading setup requires some calculations based on the latest bar.
  2. Key number should be calculated first. It's based on the current price. For the quotes with 4 digits after a dot the key value is the current price multiplied by 10 and then rounded. For the quotes with 2 digits after a dot the key value is the current price divided by 10 and the rounded.
  3. Place pending Buy order at Current Price + (2 * Key value).
  4. Place pending Sell order at Current Price - (2 * Key value).
  5. Place stop-loss for pending Buy order at Open Price - (2 * Key value).
  6. Place stop-loss for pending Sell order at Open Price + (2 * Key value).
  7. Take-profit for both orders is calculated similarly to the key value but the current price should be multiplied by 100 for the quotes with 4 digits after a dot and shouldn't be divided for the quotes with 2 digits after a dot. In both cases the values should be rounded.
  8. Trailing stop is also applied to the orders and is set to 2.5 * Key value.
  9. Don't forget to cancel the untriggered orders after the timeframe period ends.
  10. If this sounds too complicated, see the example below.

Example


Let's calculate the entry conditions and parameters for an example presented on the chart:
  1. It's a EUR/USD H4 chart.
  2. The current price is 1.4810, the current bar's open price is 1.4832.
  3. There are 4 digits after a dot in the quotes for EUR/USD. That means that the Key value is calculated as 1.4810 * 10 = 14.8. Rounding it results in 15 pips.
  4. Pending Buy order level is calculated as 1.4810 + (2 * 15) = 1.4840.
  5. Pending Sell order level is calculated as 1.4810 - (2 * 15) = 1.4780.
  6. Stop-loss for pending Buy order is calculated as 1.4832 - (2 * 15) = 1.4802.
  7. Stop-loss for pending Sell order is calculated as 1.4832 + (2 * 15) = 1.4862.
  8. Take-profit for all pending orders is calculated as 1.4810 * 100 = 148.1 or, after rounding, 148 pips.
  9. Take-profit for pending Buy order is set to 1.4840 + 148 = 1.4988.
  10. Take-profit for pending Sell order is set to 1.4780 - 148 = 1.4632.
  11. Trailing stop for both orders is set to 2.5 * 15 = 37.5 or, after rounding, 38 pips.

Credits

This trading system was originally developed by The Forexkid. The version presented here has some minor modifications.

Warning!


Use this strategy at your own risk. It's not recommended to use this strategy on the real account without testing it on demo first.

Inside Bar Trading Strategy


Inside Bar Forex trading strategy — a popular system with a nice win/loss ratio but a rather rare occurrence of the proper entry conditions. It doesn't require any indicators and can be applied on the bare candlestick or bar chart.

Features

  • Entry conditions are clearly defined.
  • Very simple bare chart system.
  • High success rate.
  • Rare occurrence of the proper conditions.

How to Trade?

  1. An inside bar is a bar or a candlestick that completely fits into the first preceding bar (also called a "container" bar), including its High and Low values.
  2. If the current bar has an index of 0 and the previous bar has an index of 1 then the following conditions should be true for the current bar to count as an inside bar: High[0] < High[1] and Low[0] > Low[1]. Mind the strict "greater" and "less" operators.
  3. Bearish inside bar that follows a bullish "container" bar on the clearly visible uptrend signals a Short position.
  4. Bullish inside bar that follows a bearish "container" bar on the clearly visible downtrend signals a Long position.
  5. Stop-loss is set to the Low of the "container" bar for the Long positions and to the High of the "container" bar for the Short positions.
  6. Take-profit should be set to the nearest support/resistance level formed by the trend.

Example


A bullish inside bar after a downtrend is shown on the example chart. The inside bar is easy to identify and the stop-loss level is rather conservative here. The target was set to the resistance level formed by the previous downtrend. As you can see, the currency pair rate reached the take-profit level without any problems.

Warning!

Use this strategy at your own risk. It's not recommended to use this strategy on the real account without testing it on demo first.

Combined Stochastic Oscillator/MA Trading Strategy


Combined Stochastic Oscillator/MA Forex trading strategy — is a relatively safe trading system that is based on the standard Stochastic Oscillator indicator in combination with the standard Exponential Moving Averages. You can use the moving averages as the general long-term trend indicator, while the stochastic will show you the short-term overbought/oversold states, where you can enter a successful pull-back trade.

Features

  • Rather reliable.
  • Trading with the trend.
  • Isn't very easy to follow.
  • No definite target/exit levels.

Strategy Set-Up

  1. Any currency pair should work. Use D1 timeframe for the long-term trend detection with the Exponential Moving Averages and H1 timeframe for the short-term signal receiving with the Stochastic Oscillator.
  2. Add 3 Exponential Moving Averages to the D1 chart, set periods to 50, 100 and 200.
  3. Add a Stochastic Oscillator indicator to the H1 chart, set its %K period to 14, %D period to 3 and slowing to 3, use Close/Close price field, set overbought level to 90% and oversold level to 10%.

Entry Conditions
Enter Long position when the long-term trend is bullish (the D1 chart shows price above EMA50, EMA50 above EMA100 and EMA100 above EMA200) and the stochastic crosses the oversold level from below on H1 chart.

Enter Short position when the short-term trend is bearish (the D1 chart shows price below EMA50, EMA50 below EMA100 and EMA100 below EMA200) and the stochastic crosses the overbought level from above on H1 chart.

Exit Conditions
There are no definite SL/TP levels, but the recommended risk/reward ratio is 1/2.

A rather tight trailing stop should be maintained.

Example
Bearish trend:


Bullish trend:


On the example charts you can see the December 14, 2009 signals generated both for the bearish EUR/AUD and for the bullish AUD/CHF charts. As you see, the signal line for stochastic oscillator is the actual stochastic, not its MA. The exponential moving averages should form an almost perfect trend for the more accurate signals. In the Short position example both positions would hit a rather optimistic take-profit. In the Long position example the second trade would end with almost no loss if a tight trailing stop was used.

Warning!

Use this strategy at your own risk. It's not recommended to use this strategy on the real account without testing it on demo first.

MACD Divergence Trading Strategy


MACD Divergence Forex trading strategy — is one of the quite reliable systems and is based on the standard MACD indicator. Actually, the divergence between MACD line and the currency pair rate is the basic signal in this strategy. This system has rather fuzzy entry and exit points, but it's easy to spot the signal and the trades can be rather profitable, as it helps to catch the pull-backs and the trend reversals.

Features

  • Easy to spot signals.
  • Only one standard indicator used.
  • Good profit potential on positions.
  • Take-profit and stop-loss levels are rather indefinite.
  • Rare occurrence on the long-term charts.

Strategy Set-Up

  1. Any currency pair and timeframe should work. But shorter timeframes are recommended, as they yield more opportunities.
  2. Add MACD (Moving Average Convergence/Divergence) indicator to the chart, set Fast EMA period to 12, Slow EMA period to 26 and MACD SMA to 9; apply to Close.

Entry Conditions
Enter Long position when the price shows a bearish trend and MACD indicator shows a bullish trend.

Enter Short position when the price shows a bullish trend and MACD indicator shows a bearish trend.

Exit Conditions
Set stop-loss to the nearby support level, when going Long, or to the nearby resistance level, when going Short.

Set take-profit to the next resistance level for Long positions, or to the next support level for Short positions.

If the system generates a reversal signal — close the previous position first.

Example


The example chart is EUR/USD currency pair at M15 timeframe. As seen on the chart, the price line was declining in a bearish trend, while the MACD indicator was rising in a bullish trend during rather long period. The entry point is marked at the level, where it's became clear that the downtrend is over on the currency pair chart. Stop-loss was set to the support level formed by the double-bottom chart pattern, while the take-profit level was set to the level of resistance formed by bearish trend's short-lived pull-backs. The TP/SL ratio is rather good here — about 1.5.

Warning!

Use this strategy at your own risk. It's not recommended to use this strategy on the real account without testing it on demo first.


Stochastic Oscillator Trading Strategy


Stochastic Oscillator Forex trading strategy — it's an interesting system with a rather low fail rate. It's based on a standard Stochastic Oscillator indicator, which signals a trend fatigue and change. That means that you will almost always enter on pull-backs, guaranteeing rather safe stop-loss levels.

Features

  • Simple to follow.
  • Only one standard indicator used.
  • Safe stop-loss levels.
  • Take-profit level isn't optimal.

Strategy Set-Up

  1. Any currency pair and timeframe should work. But longer timeframes are recommended.
  2. Add a Stochastic Oscillator indicator to the chart, set its %K period to 14, %D period to 7 and slowing to 7, use Simple MA method.

Entry Conditions
Enter Long position when the cyan line crosses the red one from below and both are located in the bottom half of the indicator's window.

Enter Short position when the cyan line crosses the red one from above and both are located in the upper half of the indicator's window.

Exit Conditions
Set stop-loss to the local maximum if going Long and to the local minimum if going Short.

The most comfortable level for take-profit is between 1 * SL and 1.5 * SL.

Close position immediately if another signal is generated.

Example


5 signals for this strategy can be seen on the example chart above. All stop-loss levels are marked with the yellow horizontal lines on the chart. The first signal is for Short position with a close stop-loss; take-profit is achievable here. The second one is a bullish signal, which turns out to be a wrong pull-back, but, fortunately enough, the stop-loss is quite tight here. The third signal is not a signal actually, because it's a bearish figure cross that appears in the bottom half of the window and thus is disregarded. Fourth signal is bullish with a stop-loss quite far away, but even the most aggressive take-profit level would work here. The final signal is for Short, with tight stop-loss and a lot of place for a rather profitable TP setting.

Ideally bullish and bearish signals should follow one after another but due to the occurrence of the false signals (bearish in the bottom half and bullish in the upper half of the window) it's not always so.

Warning!

Use this strategy at your own risk. It's not recommended to use this strategy on the real account without testing it on demo first.

Parabolic SAR Trading Strategy


Parabolic SAR Forex trading strategy — is a rather risky system that is based on direct signals of the Parabolic SAR indicator, which shows stop and reverse levels.

Features

  • Simple to follow.
  • Only one standard indicator used.
  • Entry and exit conditions are given directly by the indicator.
  • Indicator lag.
  • Very risky and not always effective.

Strategy Set-Up

  1. Any currency pair and timeframe should work.
  2. Add a Parabolic SAR indicator to the chart, set its step to 0.05 and maximum to 0.2.

Entry Conditions
Enter Long position when the current price touches the indicator from below and it changes its direction.

Enter Short position when the current price touches the indicator from above and it changes its direction.

Exit Conditions
Set stop-loss directly at the indicator level — above the price for Short positions and below the price for Long positions. Adjust stop-loss with each new bar.

Take-profit should be set to the same value as stop-loss but you shouldn't adjust it.

Example


As you can see on the example chart above, there are 6 entry points. The first one is bullish and leads to a profit. The second one is bearish and also reaches take-profit level. The third one is bullish and is a complete loss, as is the fourth one, which is, of course, bearish. The fifth one doesn't reach take-profit level but it closes with only a minor loss; it's bullish. The sixth one is a short position and has already reached its recommended take-profit.

Judging from above it's easy to conclude that short and long positions always follow one after another in this strategy and that it's not very reliable one.

Warning!

Use this strategy at your own risk. It's not recommended to use this strategy on the real account without testing it on demo first.

Moving Average Cross Trading Strategy


Moving Average Cross Forex trading strategy — is a simple system that is based on the cross of the two standard indicators — the fast EMA (exponential moving average) and the slow EMA. You can also use our free Adjustable Moving Average Cross expert advisor to trade this strategy automatically in MetaTrader platform.

Features

  • Very easy strategy to follow.
  • Simple indicators used.
  • It's easy to set stop-loss.
  • Moving averages are laggy — can lag up to 10 bars.
  • Ineffective during the flat markets.

Strategy Set-Up

  1. Any currency pair and timeframe should work.
  2. Add an exponential moving average to the chart, set its period to 9, apply to Close, set color to red (optional) — this is your fast moving average (FMA).
  3. Add another exponential moving average to the chart, set its period to 14, apply to Close, set color to blue (optional) — this is your slow moving average (SMA).

Entry Conditions
Enter Long position when FMA crosses SMA from below.

Enter Short position when FMA crosses SMA from above.

Exit Conditions
Stop-loss for Long positions should be set to the Low of the last candle before the cross occurred. For Short positions — to the High of the last candle before the cross.

Take-profit should depend on the stop-loss and should be not less that stop-loss. I recommend setting TP to 1.5 * SL or 2 * SL.

If another cross appears before the stop-loss or take-profit are triggered close the position.

EXAMPLE


As seen on the example chart, entry conditions are quite clear and with the proper TP/SL ratio, this strategy can be quite profitable.

Warning!

Use this strategy at your own risk. It's not recommended to use this strategy on the real account without testing it on demo first.


Adjustable MA Expert Advisor


Adjustable MA Forex expert advisor is a customizable moving average EA that offers flexible tuning of the traditional 2-MA cross strategy. You can set different MA periods, MA types, minimum difference, stop-loss, take-profit, trailing stop and slippage. This expert advisor always opens position on cross and closes it on the next cross.

The back-test of the Adjustable MA MetaTrader expert advisor on the 1-year period showed ~19.5% profit with ~10% maximum drawdown. The used position's volume was set to 0.1 standard lots. The EA made 248 trades, of which 60.48% were profitable. The default settings were used in this back-test on EUR/USD M5 chart.


Downloads


Download Adjustable MA expert advisor for MetaTrader 4


Saturday, April 7, 2012

Forex Signal


Make huge profits easily. Get the BEST Forex Signals available online now. Award-winning and most transparent service.

Honesty is our primary, essential value.

Stop losing money following bad signals.

Make big profits the easy way. Subscribe NOW!

GET SERVICE!

READ THE FACTS: Why Profit Forex Signal is the best...


100% of our clients make pips from our PROFIT FOREX SIGNAL service starting on the first day.


DO NOT ACCEPT ANY CHEAP OR FREE FOREX ALERT SERVICE. THERE IS ONLY ONE PROVEN SERVICE YOU NEED, THAT'S PROFIT FOREX SIGNAL!!!

If You want to know more about our amazing service simply email us at info@profitfxsignal.com OR click "get service" now. You'll be in systems in minutes.


Get Paid To Promote, Get Paid To Popup, Get Paid Display Banner